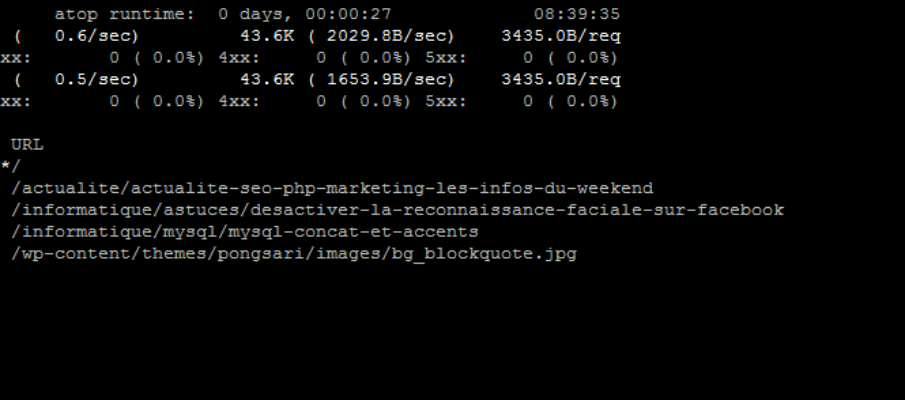
 Apache is great and so is Cpanel, but when you need to find out what is using resources or causing a low-down the tools can be limited, Apachetop helps by providing real-time analysis.
One of the most useful methods is to look at the raw apache logs, however if you’ve got a very busy site, or a server with dozens (or more) of domains then apachetop might help.
Cpanel note
If you are using cpanel I recommend you get the domain logs combined, instructions here (there are other methods any will work).
Centos
Instructions for installing below are on CentOS, however you can install it on most Linux distributions.
EPEL
First of all enable EPEL, this gives you access to 3rd party repo’s not directly maintained by Centos (so insert the usual trust issue message here).
To do this just run the following – if this doesn’t work have a quick google for epel-release rpm and find the one for your version of Centos
yum install epel-release
Note installing this rpm will remove your cache files for yum, so the next command make take a few more minutes than you are used to
install apachetop
yum install apachetop
That’s it!
Using apachetop
Run it and pipe the log file to it – it reads from that point onwards – press space to refresh the stats more often than the default.
apachetop -f /usr/local/apache/logs/vhost-access_log
Tips
When running press ? to get some help. I tend to use d to cycle through the stats, of particular interest to me is the host view, this shows the number of hits and transfer for a host, so if you have a badly behaving one it stands out. Another view shows the referrers, very useful if a site has had some publicity and is getting a lot of traffic.
Generally I recommend leaving it at least 5 minutes to gather some stats – this then gives you enough time to evaluate the results.
Have fun and happy debugging!
